

This article is written for those who want to get better at using price to earnings ratios (P/E ratios). To keep it practical, we’ll show how S.P. Apparels Limited’s (NSE:SPAL) P/E ratio could help you assess the value on offer. S.P. Apparels has a P/E ratio of 11.74, based on the last twelve months. That is equivalent to an earnings yield of about 8.5%.
View our latest analysis for S.P. Apparels
Contents
- 1 How Do I Calculate A Price To Earnings Ratio?
- 2 Is A High Price-to-Earnings Ratio Good?
- 3 How Growth Rates Impact P/E Ratios
- 4 How Does S.P. Apparels’s P/E Ratio Compare To Its Peers?
- 5 Remember: P/E Ratios Don’t Consider The Balance Sheet
- 6 Is Debt Impacting S.P. Apparels’s P/E?
- 7 The Verdict On S.P. Apparels’s P/E Ratio
How Do I Calculate A Price To Earnings Ratio?
The formula for P/E is:
Price to Earnings Ratio = Price per Share ÷ Earnings per Share (EPS)
Or for S.P. Apparels:
P/E of 11.74 = ₹311 ÷ ₹26.5 (Based on the year to December 2018.)
Is A High Price-to-Earnings Ratio Good?
A higher P/E ratio means that buyers have to pay a higher price for each ₹1 the company has earned over the last year. That is not a good or a bad thing per se, but a high P/E does imply buyers are optimistic about the future.
How Growth Rates Impact P/E Ratios
P/E ratios primarily reflect market expectations around earnings growth rates. When earnings grow, the ‘E’ increases, over time. That means even if the current P/E is high, it will reduce over time if the share price stays flat. A lower P/E should indicate the stock is cheap relative to others — and that may attract buyers.
Most would be impressed by S.P. Apparels earnings growth of 15% in the last year. And earnings per share have improved by 22% annually, over the last five years. This could arguably justify a relatively high P/E ratio.
How Does S.P. Apparels’s P/E Ratio Compare To Its Peers?
The P/E ratio indicates whether the market has higher or lower expectations of a company. The image below shows that S.P. Apparels has a P/E ratio that is roughly in line with the luxury industry average (12.3).
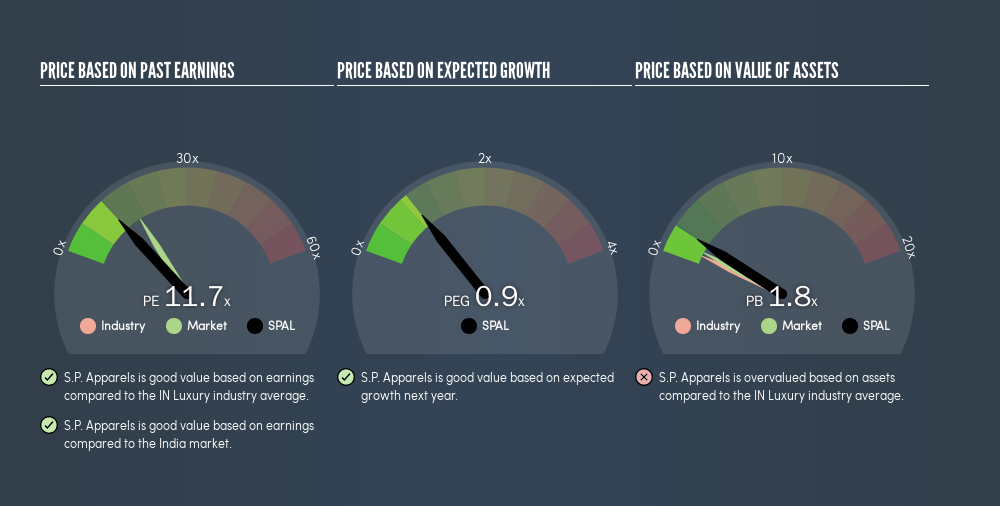
Its P/E ratio suggests that S.P. Apparels shareholders think that in the future it will perform about the same as other companies in its industry classification. If the company has better than average prospects, then the market might be underestimating it. I inform my view byby checking management tenure and remuneration, among other things.
Remember: P/E Ratios Don’t Consider The Balance Sheet
It’s important to note that the P/E ratio considers the market capitalization, not the enterprise value. That means it doesn’t take debt or cash into account. Theoretically, a business can improve its earnings (and produce a lower P/E in the future), by taking on debt (or spending its remaining cash).
Spending on growth might be good or bad a few years later, but the point is that the P/E ratio does not account for the option (or lack thereof).
Is Debt Impacting S.P. Apparels’s P/E?
Net debt totals 14% of S.P. Apparels’s market cap. It would probably deserve a higher P/E ratio if it was net cash, since it would have more options for growth.
The Verdict On S.P. Apparels’s P/E Ratio
S.P. Apparels trades on a P/E ratio of 11.7, which is below the IN market average of 16.3. The EPS growth last year was strong, and debt levels are quite reasonable. If it continues to grow, then the current low P/E may prove to be unjustified. Because analysts are predicting more growth in the future, one might have expected to see a higher P/E ratio. You can taker closer look at the fundamentals, here.
Investors should be looking to buy stocks that the market is wrong about. If the reality for a company is not as bad as the P/E ratio indicates, then the share price should increase as the market realizes this. So this free report on the analyst consensus forecasts could help you make a master move on this stock.
[“source=simplywall”]